Update: As of version 1.1, the new “Make Error Bars” command takes care of all steps after importing your data into OmniGraphSketcher.
The advantage of having such a general-purpose graphing program is that the possibilities are almost endless. So endless, in fact, that it took us until just now to realize that making vertical error bars (a popular feature request) is actually pretty easy.
As an example, suppose you ran an experiment that involved taking many imperfect measurements each year, over 12 years. One nice way of visualizing the results is to calculate a confidence interval statistic for each year of samples and display those intervals as “error bars”:
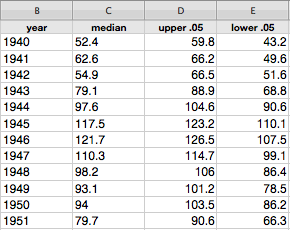
It turns out there is already a reasonably easy way to make plots like this in OmniGraphSketcher (and we hope to make it much easier in the future). First, as with any data analysis work, you will probably want to start the process using a spreadsheet or statistics program to do the necessary calculations and data organization. You will want to end up with four columns: (1) the x-value for each data bin (in our example, the year); (2) the median data value for each bin; (3) the upper end of each confidence interval (the tops of the error bars); and (4) the lower end (bottoms). Here is an example of my data in Numbers (Apple's spreadsheet program):
The x-values must be in the first column, but the other three columns can be in any order.
Here are the values as selectable text, if you want to follow along with this example yourself:
year, median, upper .05, lower .051940, 52.4, 59.8, 43.2
1941, 62.6, 66.2, 49.6
1942, 54.9, 66.5, 51.6
1943, 79.1, 88.9, 68.8
1944, 97.6, 104.6, 90.6
1945, 117.5, 123.2, 110.1
1946, 121.7, 126.5, 107.5
1947, 110.3, 114.7, 99.1
1948, 98.2, 106, 86.4
1949, 93.1, 101.2, 78.5
1950, 94, 103.5, 86.2
1951, 79.7, 90.6, 66.3
Select that whole block of data, copy it, and paste it into OmniGraphSketcher. In most cases, you should probably follow that up by setting the axis ranges with View –> Scale To Fit Data. You will end up with something like this:
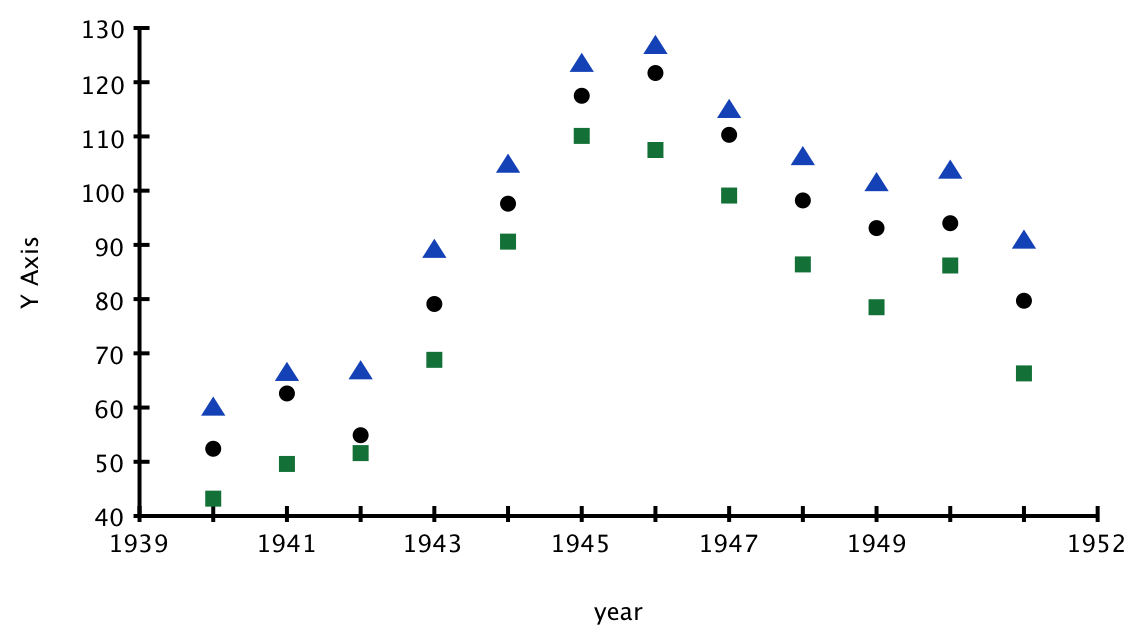
Your three data columns have become data series plots that share the x-values from the initial column.
Now, the first magic step is to turn the “tops” and “bottoms” into the tick-mark data point type. This data point style is cool because it automatically becomes perpendicular to any attached line. It's easy to select the top and bottom point series by clicking on a point from the top series, holding the shift key, and then clicking a point from the bottom series. (Both clicks will select the whole series because imported data are “grouped” by default.) Once those are selected, just choose the tick point style in the Style inspector:
Your graph should now look a bit weird, like this:
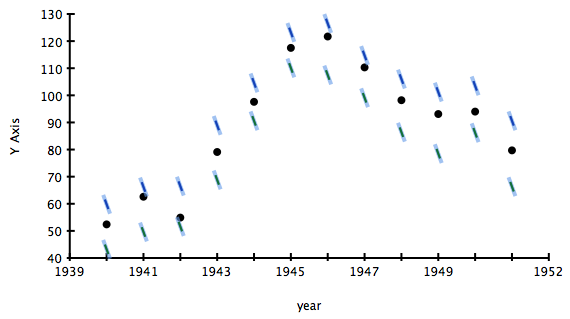
Those tick mark points are at a default jaunty angle because they don't yet have lines attached. In the second magic step, you provide those lines. This is a little repetitive in OmniGraphSketcher 1.0, but not too bad unless you have dozens of data points. Start by dragging the selection box across the first vertical set of three points that will form an error bar group. When those are selected, hit command-shift-K (which corresponds to Edit –> Line –> Straight). Ta-da, you have your first error bar! Now you will have to go through each vertical set, selecting the points and hitting command-shift-K. When you're done, you should have something like this:
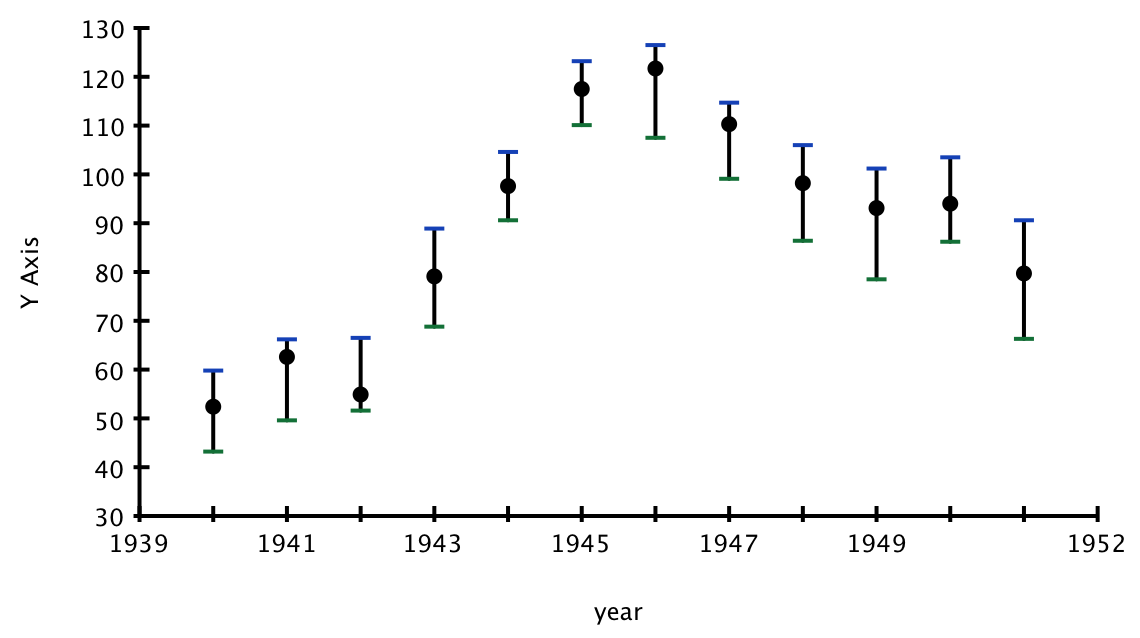
How lovely! You can still easily select all of the “tops” or “bottoms” and change their color or size. There is one last trick to help you change the color or size of all of the “bars” themselves. Choose Edit –> Select All –> Lines. Then click on “Group” in the toolbar. Now your bars are a grouped set just like the top ticks and bottom ticks, so whenever you click on one bar, all of the other bars will also be selected. Now that you can select everything so easily, it is a snap to edit visual styles to make the error bars more subdued, if you'd like. Here they are with a dark gray color and thickness of 1.0 (and a few axis touch-ups):
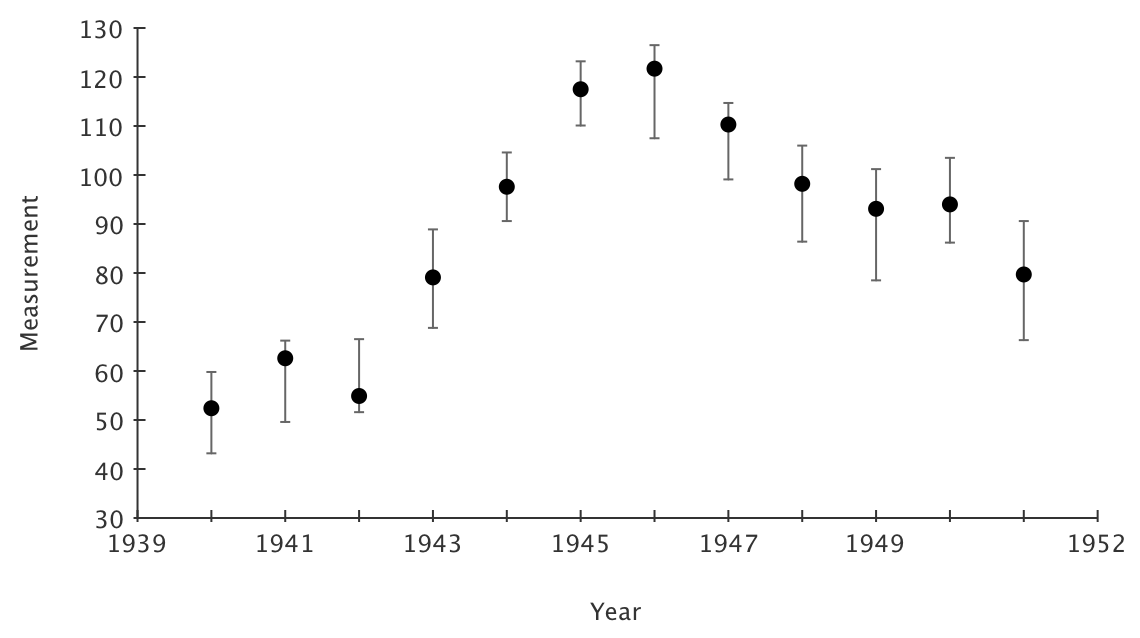
Beautiful!
In a future version of OmniGraphSketcher, we plan to include the capability to automatically find those vertical groups and do all of the repetitive steps for you.