“Wow, your customers are nerdy!”
That was a friend’s response recently when I mentioned that logarithmic axes are the number-one feature request for OmniGraphSketcher.
The way I see it, our customers understand that logarithmic scales are the best way to present many types of data and ideas. Stock prices, advances in technology, and many other phenomena tend to change by multiples rather than additions. Logarithmic scales show each doubling as a constant distance, so you can compare percent changes without large differences in absolute size getting in the way.
So I’m very excited to announce that OmniGraphSketcher 1.2 for Mac and OmniGraphSketcher 1.5 for iPad are now available, with full support for logarithmic axes!
.png)
You don’t even need to know anything about logarithms to use this feature. You just turn it on via the axis inspector, for either or both axes. (The resulting charts are sometimes called lin-log and log-log.) There is no step two!
These logarithmic axes are designed to follow best practices in information visualization, and they work seamlessly with all the other features of the app, such as dragging, nudging, snapping, sketch recognition, axis manipulation, and scale-to-fit. And because logarithmic scales are more likely to span many orders of magnitude, we now support much larger and smaller numbers (up to 10300 and down to 10-300), more decimal precision (up to 13 digits), and scientific notation (so you can use numbers like 3 x 10200 without typing 200 zeroes).
Given that the known sizes of physics only range from about 10-35 meters (the Planck distance in quantum theory) up to 1026 meters (the size of the observable universe), we figure that +/- 300 orders of magnitude should be plenty.
At least for now.
As part of these updates, we’ve also refined the algorithms that draw axis tick marks and tick labels. When there is not enough room to label every tick mark, we now consistently label every other tick mark, or every 5th, or every 10th, etc. If we skip a lot, we’ll automatically use major/minor tick marks to make it easier to see which tick marks are getting labeled.

On logarithmic axes, we show just the first five numbers between each power of ten when possible, then only the powers of ten themselves, and then evenly-spaced powers of ten. OmniGraphSketcher makes all of these decisions for you, so you never have to think about it.


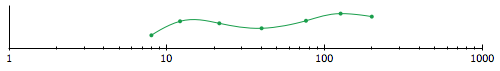
And did I mention that your axis ranges don’t have to end on powers of ten? Suppose your data values fall between 8 and 200. In many charting programs, the best you can do is this:
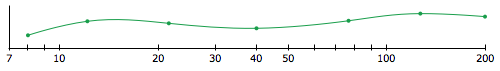
But we think logarithmic axes should be just as flexible as linear ones, and we want you to be able to switch between linear and logarithmic scales seamlessly. Again, we’ve done the work so you can get what you’d expect:
Last but not least, we’ve added a really nifty new feature called line interpolation. As you know, OmniGraphSketcher lets you draw lines freehand even if you don’t have exact data to back them up. This is great if you have a rough idea of a trend or want to visualize several possible scenarios. But wouldn’t it be cool if you could also turn your sketched lines into sampled data points for analysis or re-plotting in another program? That’s exactly what line interpolation does. It samples at each horizontal tick mark (x-value) to convert your line into a data series.
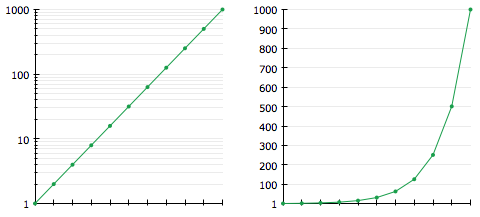
The reason we’re introducing this at the same time as logarithmic axes is because it lets you see how the shape of a line differs in linear vs. logarithmic space. Regular lines in OmniGraphSketcher simply connect two or more data points as smoothly as possible, so intermediate values do not necessarily stay the same when you convert between linear and logarithmic scales. Line interpolation solves this by letting you anchor some of the intermediate points. Now you can easily demonstrate, for example, how a straight line in logarithmic space becomes an exponential curve in linear space:
Download the latest versions of OmniGraphSketcher from the App Store (Mac, iPad) or from our online store (Mac); or use the built-in software update to download automatically.
And let us know what you think!
(If you want all the details, check out the release notes for the Mac and iPad versions.)