And we're back! With another installment of OMNI APPS—IN ACTION, which I have to say is almost as awesome of a title as my toddler's favorite DVD on the face of this earth, HORSES—CLOSE UP AND VERY PERSONAL.
(Spoiler alert! The movie features horses.)
This week we've got a really interesting OmniGraphSketcher use case to share with you, thanks to Troy Payne, a PhD candidate at the University of Cincinnati. He's working on a grant for the Ohio Office of Criminal Justice Services, and is currently offering data analysis and problem solving services at no cost to small and medium-sized Ohio police departments. He writes,
One suburban police jurisdiction thought they had a huge increase in robbery in 2009. They asked for our help to determine why. When the research team dug into the problem, we found that there wasn't an increase at all, on average. A handful of 2009 months were higher compared to 2008, which probably accounts for the perception of an increase. But the overall trend was not one of explosive increases.
Troy's team worked on different ways to visualize this information, beginning with a basic OmniGraphSketcher line chart that plotted raw counts for each year for which they had data (2006-2009) by month:
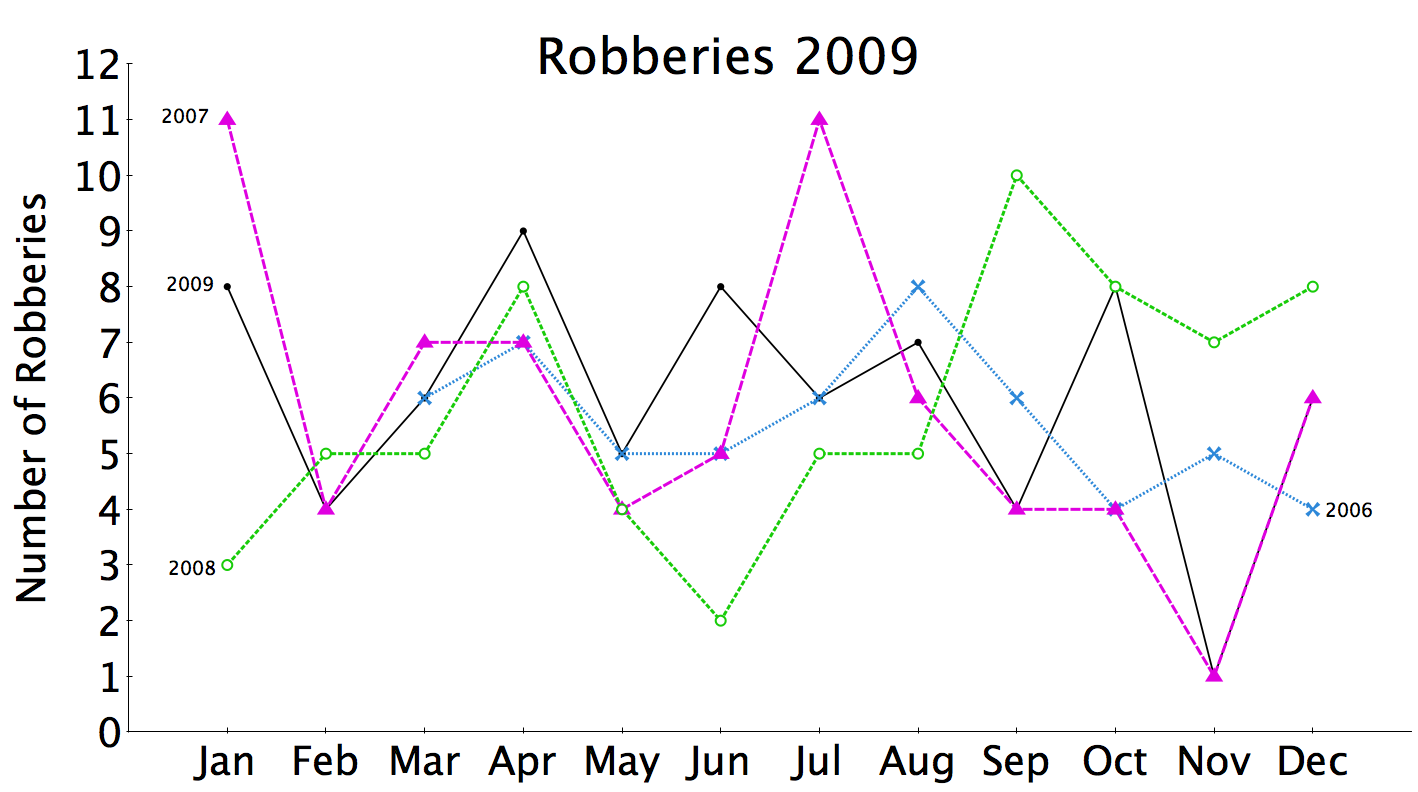
He goes on to explain,
That line chart is difficult to interpret because there isn't a clear trend line. Frankly, it's a confusing mess, with each year overlapping all the others. This is very common with crime counts, particularly in small jurisdictions where the counts are low. Here, the monthly robbery counts are in the single digits and are highly volatile.
We needed to simplify this chart or our message would get lost.
OmniGraphSketcher to the rescue!
We decided to create an area that was ±1 standard deviation from the 2006-2008 average for each month and plot the 2009 robbery counts against that. While not a true confidence interval in the statistical sense - because we're plotting the standard deviation instead of the standard error - this does provide a cleaner visualization of how "typical" 2009 robbery counts are:
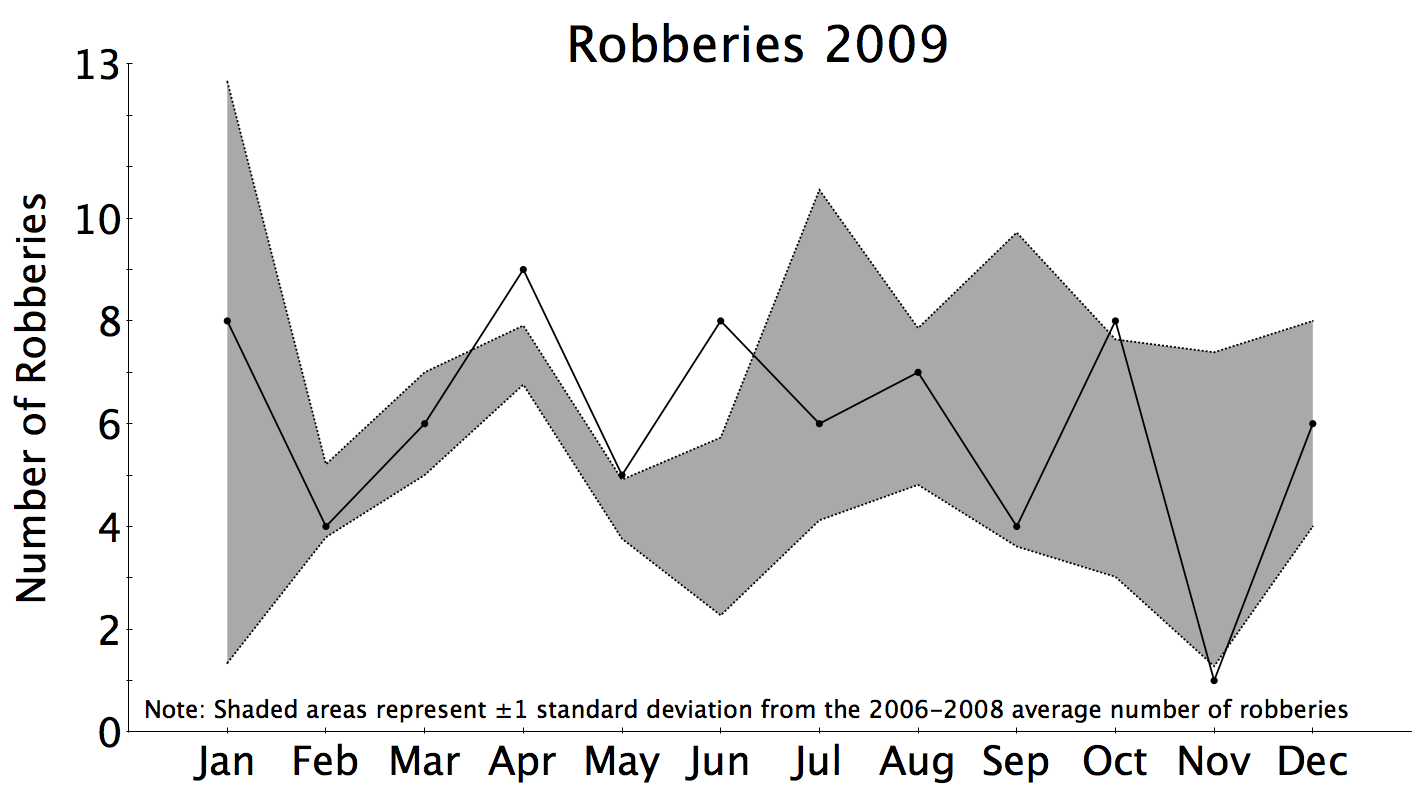
The take home message: Robbery was pretty much where we'd expect in 2009. There was not a large increase in robbery.
Hooray for robbery not increasing, right? Hooray for data visualization!
Want to know how Troy created that chart? You're in luck, because he was nice enough to tell us:
I have a spreadsheet in Excel that has the crime counts by month for each year. I created columns for the average and standard deviation, then created columns for the average ±1 standard deviation.
Then I had to get the result into OmniGraphSketcher. For me, the easiest way to do this was to copy/paste one series (i.e., column) of data at a time. I started with the low end of the shaded area. I hid the columns B-E in Excel, selected the month and mean-1s columns, hit command-c, switched to OGS, hit command-v. Then, in the OmniGraphSketcher inspector, I clicked the connect points button. Next, I repeated that process with the mean+1s column, making the upper bound of the shaded area.
The shaded area itself was created using the fill tool in OmniGraphSketcher, which is delightfully simple to use. It just works.
It's taken me *far* longer to describe what we did than to actually do it in OmniGraphSketcher. And that's the power of the app. I can quickly create stunningly beautiful charts that convey the ideas I need to convey. Instead of focusing on how to fiddle with the software, I can focus on how my message should best be transmitted to my audience.
Aw, man. We love happy customers SO MUCH. Thank you, Troy!